You’re spending money to get customers. Eventually, that spending is supposed to come back to you as profit. CAC payback period tells you exactly how long “eventually” actually takes.
This number gets asked about a lot: by board members, by investors doing diligence, and by your own team trying to decide how hard to push on growth next quarter.
The good news: the math isn’t complicated. The formula has three ingredients, and once you know what they are, you can calculate your own payback period in a few minutes.
This post walks through what CAC payback period means, how to calculate it correctly, what “good” looks like by stage and go-to-market motion, and what to do if your number is longer than you’d like.
Key takeaways
- CAC payback period measures how many months it takes to recover what you spent acquiring a customer, using that customer’s gross profit, not their total revenue.
- The formula has three moving parts: acquisition costs, ARPA, and gross margin. Blend them across every channel and you’ll hide exactly where your real problem is.
- “Good” depends more on deal size and go-to-market motion than on ARR stage alone. Self-serve motions tend to run faster, enterprise motions slower.
- Investors care less about a single number than about the trend. A payback period that keeps stretching quarter over quarter worries a board more than one soft month does.
- You can shorten payback period through pricing, expansion revenue, onboarding speed, or gross margin. Cutting ad spend is only one lever among several.
{{ inline_toc }}
What is CAC payback period?
CAC payback period is the number of months it takes to recover what you spent acquiring a customer, measured against the gross profit that customer generates, not their total revenue.
That distinction matters. Revenue is what a customer pays you. Gross profit is what’s left after you subtract the cost of actually serving them: hosting, support, onboarding, whatever it takes to deliver your product. CAC payback period asks how long it takes that gross profit to add up to what the customer cost you in the first place.
It’s easy to mix up with two related terms. CAC (Customer Acquisition Cost) is a flat dollar figure. CAC payback period is a time-based ratio built from that figure. LTV:CAC is a different question entirely: it compares total lifetime value against acquisition cost, with no clock attached. A company can post fast payback and still have a mediocre LTV:CAC ratio, if customers churn soon after breaking even.
Here’s a quick example. A customer costs you $12,000 to acquire. They pay $1,500 a month, and your gross margin is 75%. That’s $1,125 a month in gross profit. Divide $12,000 by $1,125, and you land at a payback period of roughly 10.7 months.
The CAC payback period formula
The formula itself is simple:
CAC Payback (months) = Fully-Loaded Acquisition Costs ÷ (ARPA × Gross Margin %)
Each input needs a specific definition, or the output won’t mean much.
Fully-loaded acquisition costs include more than ad spend. Add in sales and marketing salaries, commissions, and the tools your team uses to generate and close leads. Leave any of that out and your payback period will look faster than it really is.
ARPA is average revenue per account: what a typical customer pays you over a given period. Adjust gross margin for cost of goods sold, not top-line revenue. Skip that adjustment and the math quietly overstates how fast you’re actually recovering cash.
Using the example from the last section: $12,000 in acquisition costs, divided by $1,500 ARPA times 75% gross margin ($1,125), lands at 10.7 months.
One mistake shows up constantly: blending CAC across every acquisition channel into a single number. Paid, organic, and outbound often have payback periods that differ by 2–3x. A blended figure can look perfectly healthy while one channel is quietly burning cash. Where you have enough volume, calculate payback separately by channel. The gaps usually point straight at where to spend less and where to spend more.
The formula doesn’t care what you plug into it. You can run it across your whole business, or narrow it down to a single channel, campaign, or team: just your paid ads, just outbound, just one product line. The ratio works the same way at any scope. What changes is which costs and which revenue you’re feeding into it, and that flexibility is exactly why a single company-wide number can hide more than it reveals.
If you’re tracking this by hand in a spreadsheet, breaking it out by channel gets tedious fast, and it’s easy to fall back on one blended number out of convenience, even though that’s exactly the number most likely to hide the real problem.

What's a good CAC payback period for SaaS?
Deal size shapes this number more than ARR stage does, which is why segment-based benchmarks tend to be more useful than a single universal target.
Bessemer Venture Partners’ research on scaling cloud companies puts average CAC payback in the $1M–$10M ARR range at around 15 months. That figure tends to climb slowly as a company matures, since early customers are usually the cheapest to win. Broken out by segment, the guidance looks like this:
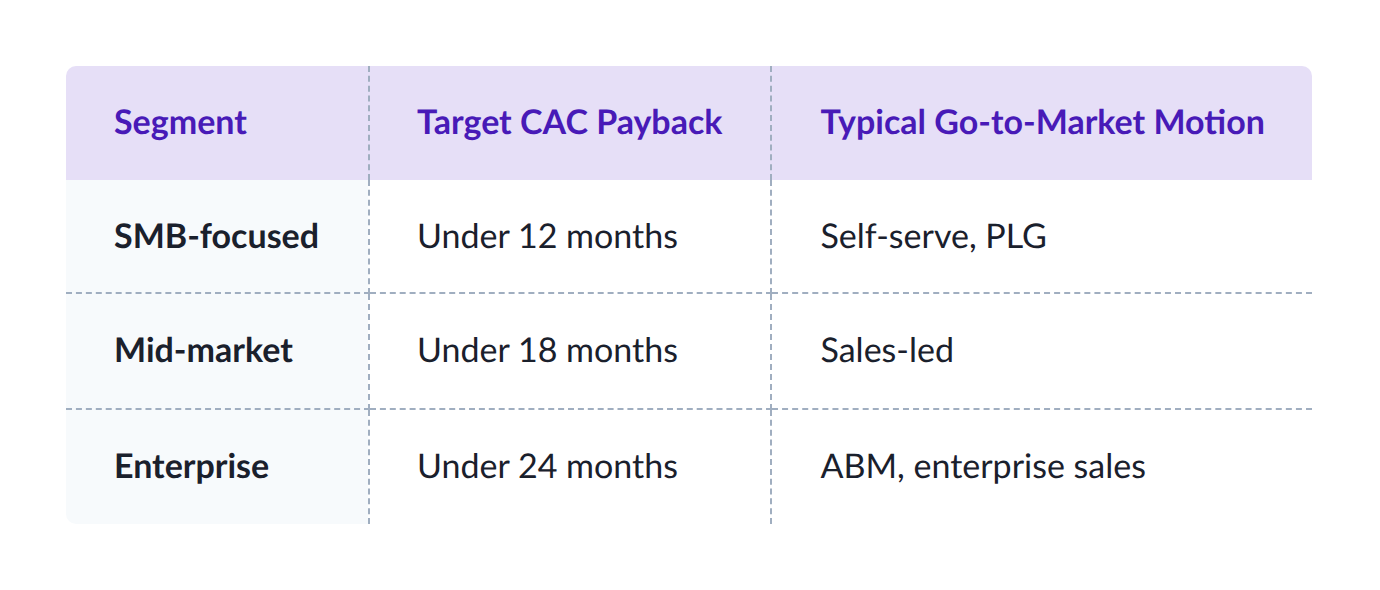
Go-to-market motion tracks closely with segment, for an obvious reason: motion is usually what determines your deal size in the first place. Self-serve and PLG motions tend to land at the faster end, since the product does a lot of the selling with little human cost attached. Sales-led motions run in the middle. ABM and enterprise motions, with longer sales cycles and heavier onboarding, land at the slower end of the range.
Investor expectations follow a similar shape: tighter for smaller, faster-closing deals, looser for enterprise motions. Treat any single hard cutoff with some skepticism. What matters more is comparing your number against companies with a similar deal size and motion, not against the market as a whole.
Why investors and boards watch this number
CAC payback period shows up early in almost every fundraising process. It’s a standard line in the data room, alongside burn multiple, gross margin, and net revenue retention, because it answers a direct question for investors: how efficiently your growth engine turns a dollar of spend into cash back in the business.
That focus on efficiency got a lot more pointed after 2022. The growth-at-all-costs era rewarded founders for spending aggressively and worrying about efficiency later. Rising interest rates changed the math. Capital got more expensive, and investors started weighing efficiency almost as heavily as growth rate itself.
Here’s what matters in a board meeting: a single soft quarter of CAC payback is a data point. A payback period that keeps stretching quarter after quarter is a trend, and trends are what boards act on. Rising acquisition costs, slowing expansion revenue, or thinning margins compound if left alone. A board that catches the trajectory early can help you course-correct before it shows up in your runway.
{{ inline_cta }}
What's driving a slow CAC payback period
When CAC payback period stretches out, the cause almost always traces back to one of three places.
Rising acquisition costs. Channels get more expensive as they mature: CPCs climb, once-reliable outbound lists get saturated, sales cycles stretch. Ask yourself: has your blended cost per lead risen faster than your close rate has improved? If so, you’re paying more to convert the same customer.
Low ARPA or slow expansion. A weak upsell motion, or underpricing relative to the value you deliver, keeps average revenue per account flat while acquisition costs climb around it. Ask: has ARPA moved in the last two quarters, or has pricing sat frozen while your product got more valuable?
Thin gross margins. High infrastructure costs, or onboarding and customer success spend that’s outpacing revenue, eat into the gross profit meant to pay back your acquisition cost. Ask: has cost of goods sold grown faster than revenue over the past year?
Isolating which of the three moved first points you to the real fix. A reflexive “spend less on ads” response often misses the actual problem.
How to improve your CAC payback period
Once you know which lever moved, four changes shorten payback period. Cutting acquisition spend is only one of them.
Pricing and packaging. Raising prices, or repackaging existing features into a higher tier, increases ARPA without touching CAC at all. Since payback period is CAC divided by ARPA times gross margin, moving ARPA up shortens the timeline directly.
Channel mix. Shifting budget toward lower-CAC channels, such as referral, community, and organic content, before scaling paid spend further, brings the numerator down. This works best once you’ve isolated which channels are underperforming, using the per-channel breakdown from earlier in this post.
Faster onboarding and time-to-value. The clock on payback period effectively starts the moment a customer becomes active, not the moment they sign. Customers who reach value sooner tend to churn less and expand faster, both of which shorten the effective payback window.
Expansion and upsell. Growing revenue from existing customers raises ARPA with zero incremental acquisition spend attached. It’s often the fastest lever available, since you’re not paying to win the customer twice.
None of these require the blunt instrument of cutting growth spend company-wide. Combining two or three of these levers usually beats any single big swing.
Here’s how that can play out. Picture a seed-stage SaaS company sitting at a 22-month payback period, well outside what a Series A investor wants to see.
Acquisition cost isn’t the problem. Onboarding is: new customers take six weeks to reach their first real outcome in the product, and a third of churn happens before they ever get there. The team rebuilds onboarding around a single milestone customers can hit inside their first week. Time-to-value drops from six weeks to nine days. Early churn falls, expansion revenue kicks in sooner, and payback period tightens to 14 months over the next two quarters, without touching ad spend at all.

The number that tells you what to fix next
CAC payback period tells you the truth about your growth engine, both how fast it’s growing and how efficiently. A blended, once-a-quarter number hides more than it shows. A number broken out by channel, tracked over time, tells you what to fix next.
Founders who treat this as a report card metric check it before a board meeting and move on. Founders who treat it as an operating lever use it to change pricing, shift channel mix, or fix onboarding, and watch payback period shorten as a result.
Either way, the first step is the same: know your number, and know it by channel.
Still tracking this in a spreadsheet that’s a quarter behind reality? Schedule a demo and see how Forecastr tracks your CAC payback period automatically, broken out by channel, inside your live model.
Frequently asked questions
What is a good CAC payback period for a SaaS startup?
It depends heavily on deal size and go-to-market motion. SMB-focused, self-serve companies often land under 12 months. Mid-market companies tend to run 14–18 months, and enterprise or ABM motions often stretch to 18–24 months. Compare yourself against companies with a similar deal size and motion, since a single universal number doesn’t hold up across segments.
How do you calculate CAC payback period?
Divide fully-loaded acquisition costs by the product of average revenue per account (ARPA) and gross margin percentage. The result is the number of months it takes to recover what you spent acquiring a customer, from the gross profit that customer generates. Raw revenue makes the number look artificially fast. Use gross-margin-adjusted revenue for an accurate figure.
What's the difference between CAC payback period and LTV:CAC ratio?
CAC payback period measures speed: how many months until you break even on a customer. LTV:CAC ratio measures magnitude: how much value a customer generates relative to what it cost to acquire them, over their entire relationship with you. A company can have fast payback and a weak LTV:CAC ratio at the same time, if customers churn soon after breaking even, so it’s worth reading the two together.
Why is my CAC payback period getting longer?
It usually traces back to one of three causes: rising acquisition costs as channels mature or sales cycles stretch, stagnant ARPA because expansion revenue has slowed, or shrinking gross margin as onboarding and support costs grow faster than revenue. Checking CAC, ARPA, and gross margin separately usually points you to the actual fix, since a blended payback number hides which one moved.
Does CAC payback period differ by go-to-market motion?
Yes. Self-serve and PLG motions tend to post faster payback, since the product does much of the selling with little human cost attached. Sales-led motions typically run in the middle, and enterprise or ABM motions often stretch longer, given heavier onboarding and longer sales cycles. Compare against companies with a similar motion and deal size for the most useful read.
Can you calculate CAC payback period for just one channel, or does it have to be company-wide?
Yes, the formula works at any scope you choose. Run it across your whole business for a high-level read, or narrow it to a single channel, campaign, or even one rep’s book of business to see where the real efficiency, or inefficiency, is hiding. Finance teams generally find the channel-level view more useful, since a healthy blended number can mask a channel that’s quietly overspending.