
Growth used to be the whole pitch. Raise a big round, spend it fast, post a hockey-stick chart, raise again. It worked, until investors started asking how much you spent to get there.
That question has teeth now. A 100% growth rate funded by unsustainable customer acquisition costs doesn't read as ambition anymore. It reads as a business that doesn't know its own math.
Sales efficiency metrics are how you answer that question before it's asked. They measure whether your revenue engine converts spend into durable growth, or just spend into more spend.
This guide walks through five core efficiency metrics: Magic Number, CAC, CAC Payback Period, LTV:CAC, and Rule of 40. We'll calculate each one using a single example company, then show you how the right benchmark shifts by stage and by sales motion.

Key takeaways
- "Growth at all costs" no longer impresses investors. Efficiency now carries as much weight as the growth rate itself.
- Five metrics anchor most efficiency conversations: Magic Number, CAC, CAC Payback Period, LTV:CAC, and Rule of 40.
- Which metric matters most depends on your sales motion. PLG, sales-led, and hybrid companies should weight these differently.
- Investors increasingly treat efficiency as a top diligence item at Series B and beyond.
- None of this works without clean, well-categorized revenue and cost data feeding your model in the first place.
{{ inline_toc }}
Why sales efficiency matters more than growth rate alone
For most of the last decade, growth rate was the headline number. Investors wanted to see the line go up, and they mostly didn't ask what it cost to bend it that way.
That changed once capital got more expensive. Now the question isn't just "how fast did you grow." It's "how much did that growth cost you, and could you keep paying that price."
A startup growing 100% a year while burning $3 for every $1 of new revenue isn't necessarily winning. It's borrowing growth from a future round that has to materialize on schedule. If it doesn't, the growth stops being an asset and starts being a liability.
Sales efficiency metrics exist to catch that gap early, before a board meeting turns into an uncomfortable one. They show whether your go-to-market spend is building something durable or just moving the top-line number for a quarter.
Growth still matters. It just isn’t proof of anything by itself anymore. Pair it with an efficiency number, and you have a story an investor can underwrite.
The core sales efficiency metrics to track
Five metrics come up in almost every efficiency conversation, whether it's a board deck or a diligence call. Each one looks at the same underlying question from a different angle.
The Magic Number measures how much new annualized revenue you generate for every dollar spent on sales and marketing last quarter. It's the fastest gut-check for whether your go-to-market spend is working right now.
CAC, or customer acquisition cost, is the total sales and marketing spend behind winning one new customer. On its own it's just a number. Compared against what that customer is worth, it starts telling you something.
CAC Payback Period adds the timing dimension CAC alone misses. It's how many months it takes to earn back what you spent acquiring a customer, which matters enormously for cash flow even when the long-term math looks fine.
LTV:CAC compares total customer value against acquisition cost, the classic 3:1-or-better benchmark. Founders typically get this wrong in ways that come down to unit economics.
Rule of 40 adds growth rate to profit margin and checks whether the sum clears 40%. A sixth metric, Net Revenue Retention, rounds out the picture by showing how much revenue your existing customers are worth over time, though we won't calculate it in depth here.

How to calculate each metric (with examples)
Formulas make more sense with real numbers attached. So let's build one hypothetical company and run every metric through the same numbers.
Meet a $3M ARR SaaS company. Last quarter it closed at $2.85M ARR; this quarter it closed at $3M. Sales and marketing spend last quarter ran $700,000, and the team closed 70 new customers.
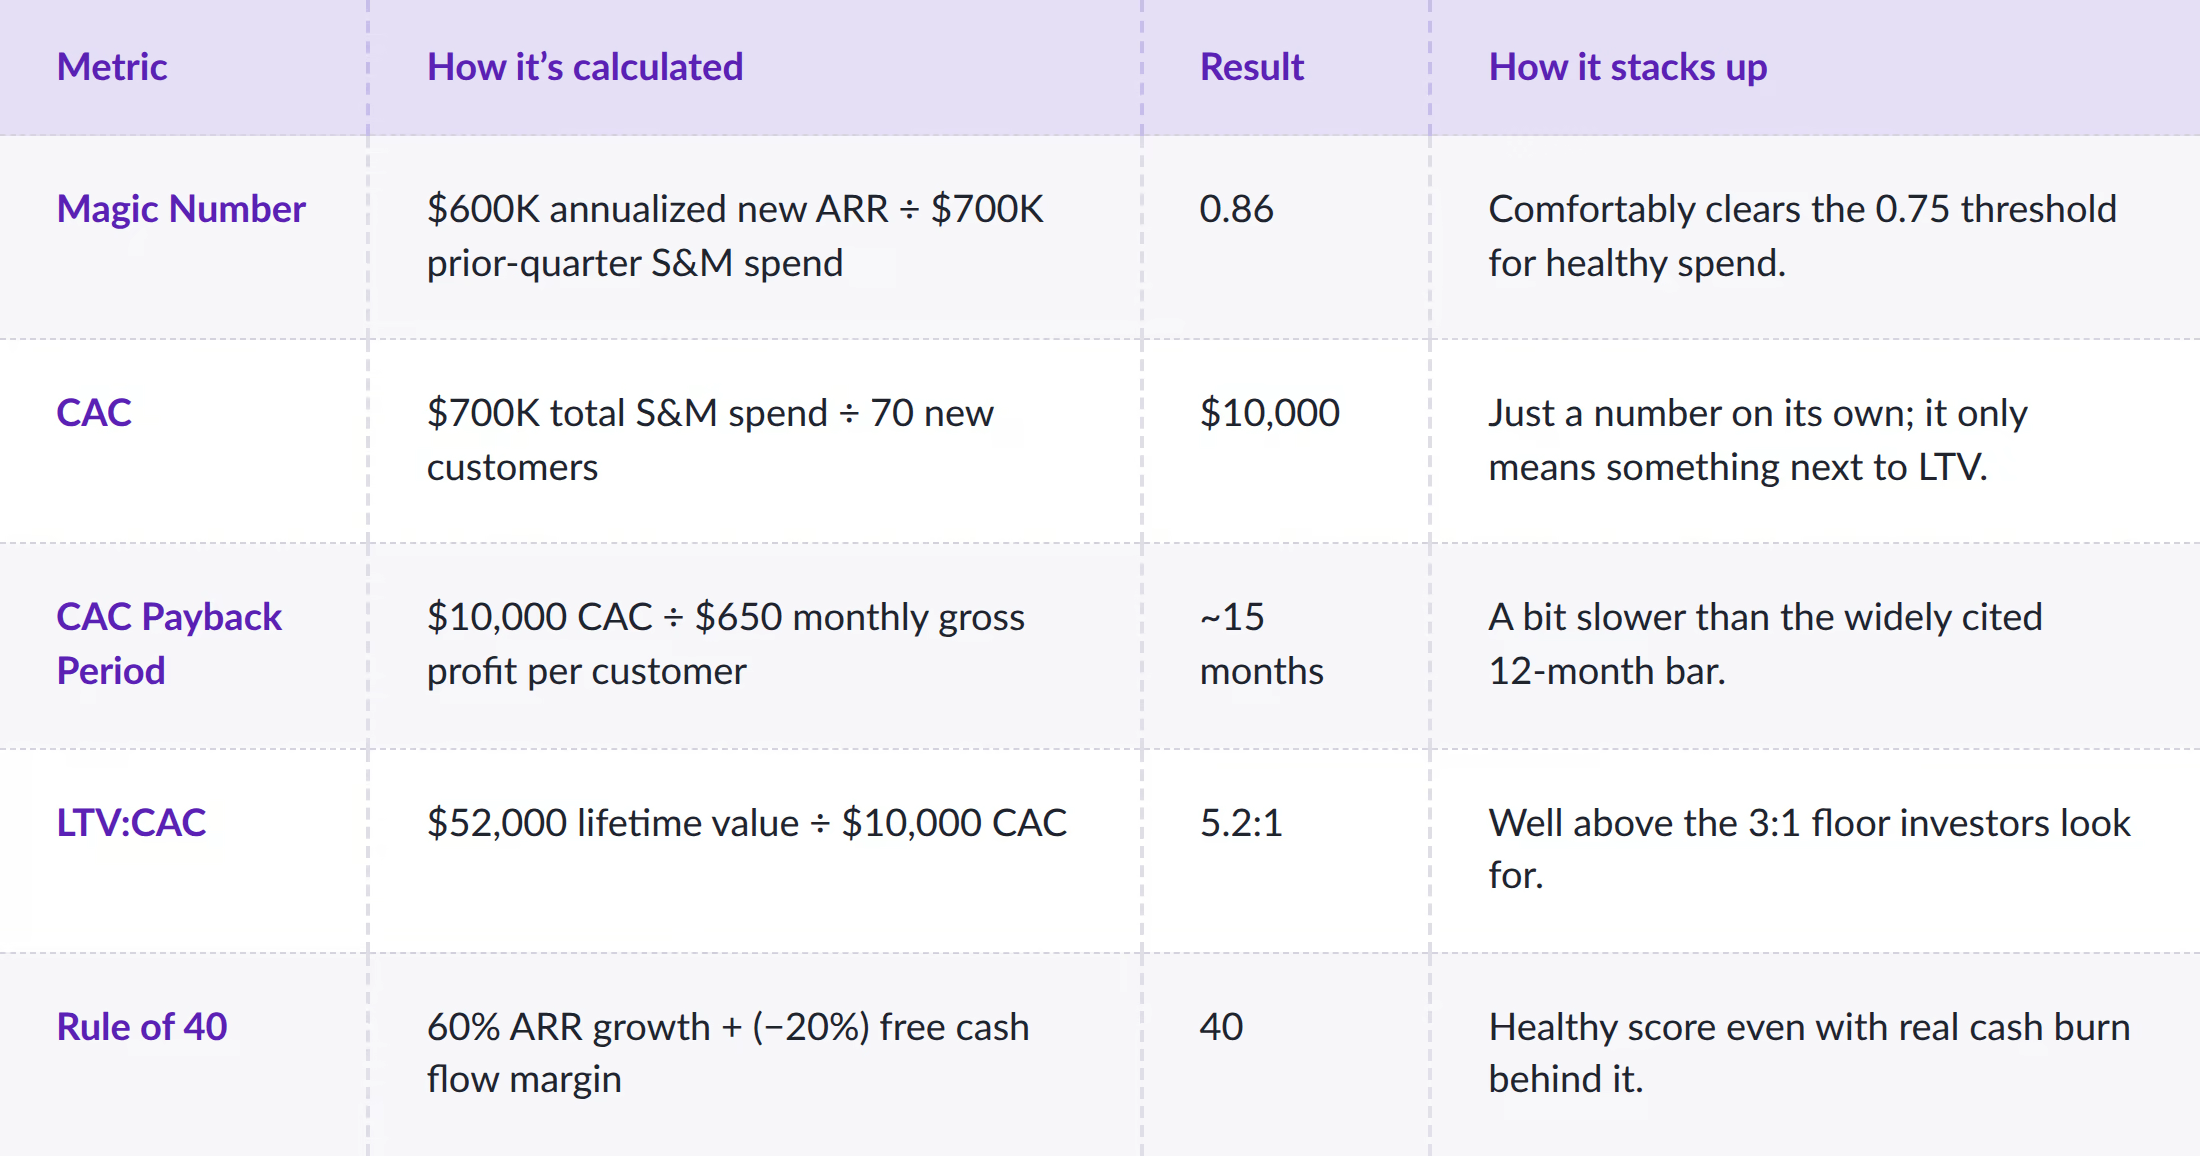
Notice what the numbers together tell you that no single one does alone. This company acquires customers efficiently and retains them well, but takes longer than ideal to recoup each acquisition dollar. That's a cash flow problem to manage, not an unsustainable business model.
Benchmarks: what good sales efficiency looks like by stage
Benchmarks only mean something in context. A Rule of 40 score that looks great at Series A can look thin at Series C, and the reverse is also true.
Seed stage. Efficiency matters least here, and that's by design. Investors are underwriting product-market fit, not capital efficiency, so a low Magic Number or a Rule of 40 score well under 40 isn't automatically a red flag if the product signal is strong.
Series A. Efficiency starts entering the conversation as investors compare you against a peer cohort for the first time. You don't need best-in-class numbers yet, but you do need to know yours cold and explain the trend line.
Series B and beyond. Efficiency becomes one of the top items in diligence, not a supporting data point. Bessemer Venture Partners' analysis of its Cloud Index found the average public cloud company posts a Rule of 40 score near 31%, while the top decile clears roughly 48%. Bessemer's newer "Rule of X" framework, which weights growth roughly twice as heavily as margin to reflect how each affects valuation, puts the top decile closer to 80.
The same research makes an important stage distinction: Rule of 40 and Rule of X apply best once a company has scale. For earlier, high-burn, high-growth companies, a burn multiple in the 1.0 to 1.5 range is often the more useful gauge than either rule.
{{ inline_cta }}
How sales motion changes which metrics matter
Not every startup acquires customers the same way, so not every startup should weight these metrics the same way either.
Product-led growth (PLG) companies acquire customers through the product itself, often with no sales rep in the loop. Acquisition cost is diffuse and hard to attribute cleanly, so PLG teams lean harder on LTV:CAC and Net Revenue Retention, which reflect whether the product keeps earning its keep after signup.
Sales-led companies concentrate acquisition cost in a rep's pipeline and a negotiated contract. That makes CAC Payback Period and the Magic Number more useful, since the spend behind each customer is easy to isolate and track quarter over quarter.
Hybrid companies, which describes most startups in practice, should track both sets. Weight them toward wherever most new revenue is originating this quarter, not wherever the org chart says sales should be winning deals.
Getting this weighting wrong is a common mistake. A PLG company obsessing over Magic Number while ignoring retention is optimizing for the wrong signal.
Building sales efficiency into your financial model
These numbers usually come together the same way: quarterly, in a side spreadsheet, right before a board meeting. That's better than not calculating them at all, but it means you're always looking backward.
The more useful version updates automatically as actuals land, so you see your Magic Number or CAC Payback trend shift in real time instead of finding out a quarter late. That's the difference between a live dashboard and a static report that's already out of date by the time anyone opens it.
None of this works, though, without clean inputs underneath it. If sales and marketing costs are miscategorized, or new customer counts don't reconcile with your CRM, every metric built on top of that data inherits the error.
That's usually where the real work starts: not building a fancier formula, but getting your revenue and cost data structured well enough to trust the formula in the first place. If you haven't built out a full financial model yet, that's the place to start before any of these ratios mean much.

Start tracking these numbers before your next board meeting
You don’t need to nail all five metrics on day one. Pick the one or two that matter most for how you sell, calculate them this quarter, and see where you land against the benchmarks above.
The real value shows up once you’re tracking the same sales efficiency metrics every quarter instead of recalculating them cold each time. You walk into the board meeting with an answer already in hand.
Ready to see these numbers update automatically instead of chasing them down every quarter? Schedule a quick conversation with our team.
Frequently asked questions
What sales efficiency metrics should a startup track?
The core set most investors and operators track is the Magic Number, CAC Payback Period, LTV:CAC ratio, and Rule of 40, each measuring a different angle of whether growth spend is paying off. Sales-led startups should weight CAC Payback and Magic Number most heavily, while PLG companies often lean more on LTV:CAC and Net Revenue Retention since acquisition costs work differently.
What's a good CAC Payback Period for an early-stage SaaS startup?
Under 12 months is generally considered efficient for early-stage SaaS, though capital-efficient or PLG companies often target under 6 months. Anything over 18 months warrants a hard look at acquisition strategy, and benchmarks should always be weighed against your specific sales motion and gross margin rather than applied as a flat rule.
What is the Magic Number in SaaS sales efficiency?
The Magic Number measures how much new annualized recurring revenue a company generates for every dollar spent on sales and marketing in the prior quarter, calculated as current quarter's annualized new ARR divided by prior quarter's sales and marketing spend. A Magic Number above 0.75 is generally considered efficient enough to justify increased investment, while a number below 0.5 suggests the go-to-market engine needs tuning before scaling spend further.
Does a good Rule of 40 score matter more than growth rate on its own?
Yes, increasingly so. Bessemer's research on its Cloud Index found growth rate has roughly twice the impact on valuation that profit margin does, but a strong Rule of 40 or Rule of X score still proves you can grow without funding it unsustainably. A company posting 60% growth and a -20% margin scores the same 40 as one growing 20% at breakeven, and both stories are credible if the trend is improving.
How does sales motion change which efficiency metrics I should report to investors?
Sales-led companies should lead with CAC Payback Period and the Magic Number, since acquisition spend is concentrated and easy to track by quarter. PLG and hybrid companies should pair those with LTV:CAC and Net Revenue Retention, since a meaningful share of their growth comes from existing customers expanding rather than new deals closing. Reporting the wrong set for your motion makes an efficient business look inefficient, or the reverse.